Understanding Support and Resistance Levels
Support and resistance levels are among the most fundamental concepts in technical analysis. Regardless of whether traders focus on stocks, forex, commodities, futures, ETFs, options, or cryptocurrency markets, support and resistance form the foundation of many trading strategies used by retail traders, institutional investors, hedge funds, and quantitative trading firms.
While modern financial markets have evolved through algorithmic trading, artificial intelligence, machine learning systems, and high-frequency trading technologies, support and resistance remain highly relevant because they are rooted in market psychology and supply-demand dynamics.
Professional traders use support and resistance levels to identify high-probability trade entries, determine stop-loss placement, establish profit targets, manage risk, and evaluate overall market structure. Understanding these critical price zones can significantly improve trading discipline and decision-making.
This comprehensive guide explores how support and resistance work, why they matter, how to identify them accurately, and how traders use them across different financial markets.
What Are Support and Resistance Levels?
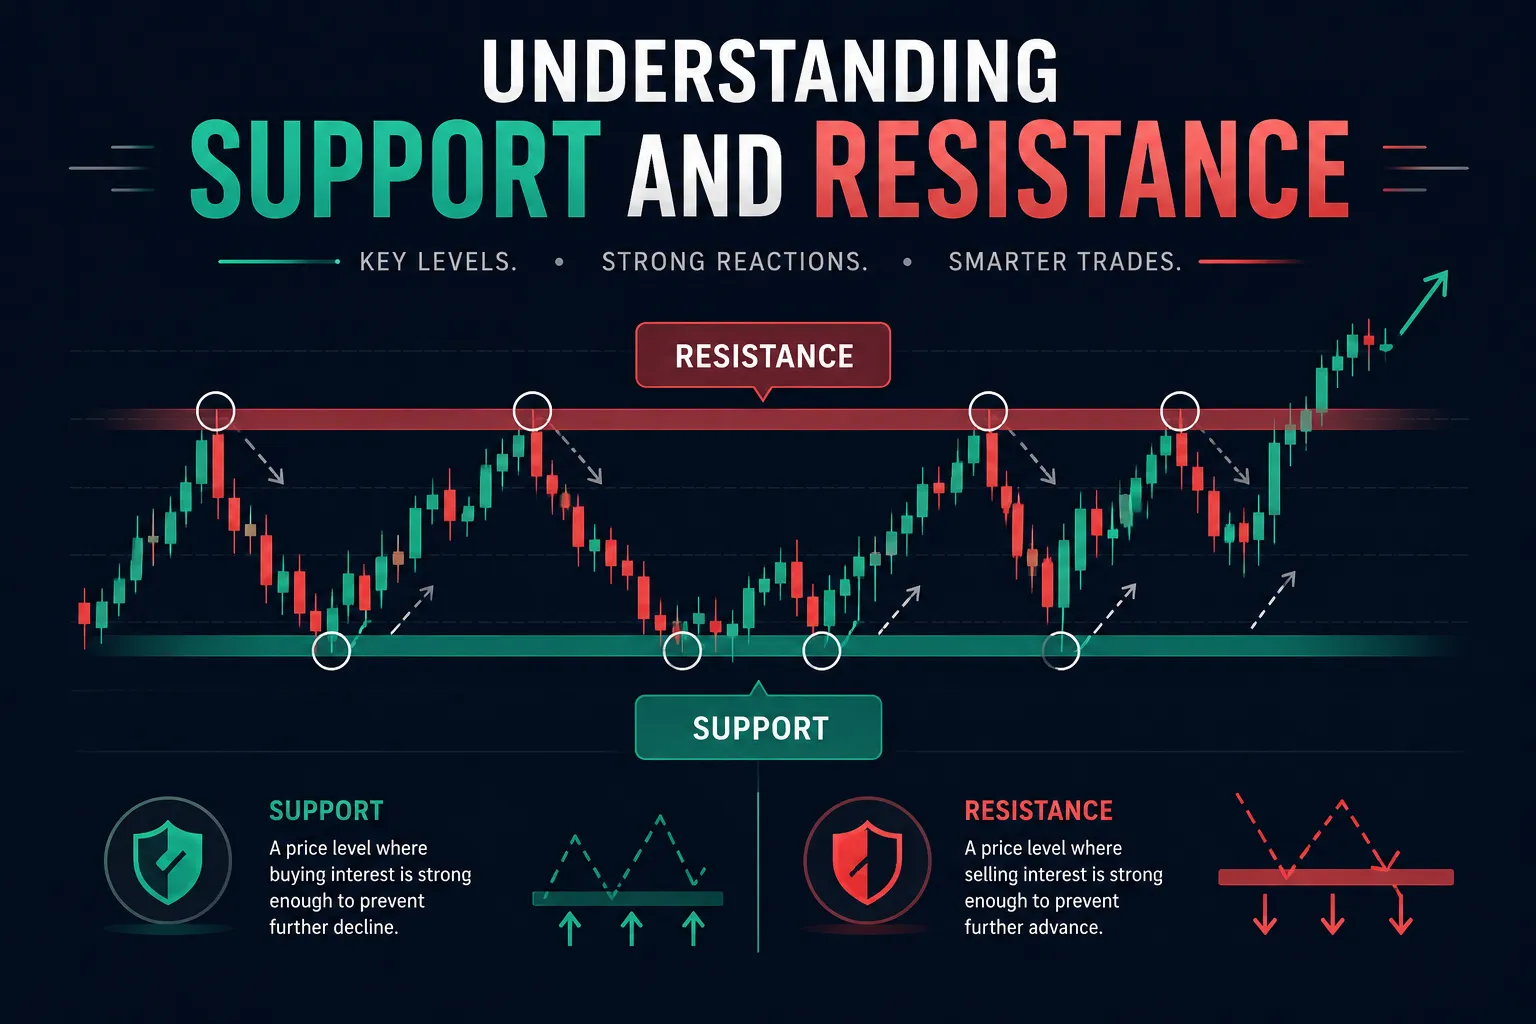
Support and resistance are price areas where buying or selling pressure has historically influenced market direction.
Support
Support is a price level where buying demand tends to exceed selling pressure, often preventing prices from falling further.
At support levels:
- Buyers become more active.
- Sellers become less aggressive.
- Prices may stabilize or reverse upward.
Resistance
Resistance is a price level where selling pressure tends to exceed buying demand, often limiting further price increases.
At resistance levels:
- Sellers become more active.
- Buyers become cautious.
- Prices may stall or reverse downward.
| Level | Market Behavior | Primary Participants |
|---|---|---|
| Support | Buying Interest Increases | Buyers |
| Resistance | Selling Pressure Increases | Sellers |
Why Support and Resistance Matter
Support and resistance levels help traders understand where significant market reactions may occur.
Benefits include:
- Identifying entry opportunities
- Planning exits
- Managing risk effectively
- Locating stop-loss levels
- Finding profit targets
- Improving trade timing
- Understanding market psychology
Many institutional trading algorithms also monitor key support and resistance zones, making them increasingly important in modern markets.
The Psychology Behind Support and Resistance
Financial markets are heavily influenced by human behavior.
Support and resistance levels exist because traders remember previous price reactions.
For example:
- Investors who missed buying opportunities near support often place buy orders when prices revisit that level.
- Traders who experienced losses near resistance may sell when prices return to those levels.
- Institutional investors frequently defend strategic price zones.
These collective actions create recurring market reactions.
Types of Support Levels
Horizontal Support
Horizontal support occurs when prices repeatedly find buying interest near the same level.
This is the most common form of support.
Trendline Support
Trendline support forms during uptrends when prices consistently bounce from a rising trendline.
Moving Average Support
Popular moving averages often act as dynamic support levels.
Examples include:
- 20-Day Moving Average
- 50-Day Moving Average
- 100-Day Moving Average
- 200-Day Moving Average
Psychological Support
Round numbers frequently attract attention.
Examples:
- $100
- $500
- $1,000
- 50,000 in major stock indexes
These levels often generate substantial market activity.
Types of Resistance Levels
Horizontal Resistance
Horizontal resistance develops when prices repeatedly struggle to move above a specific level.
Trendline Resistance
In downtrends, descending trendlines often act as resistance.
Moving Average Resistance
Major moving averages may also function as resistance during bearish market conditions.
Psychological Resistance
Round-number price zones frequently attract profit-taking and selling pressure.
| Resistance Type | Description |
|---|---|
| Horizontal | Repeated Selling Zone |
| Trendline | Downtrend Barrier |
| Moving Average | Dynamic Resistance |
| Psychological | Round Number Barrier |
How to Identify Support and Resistance Levels
Accurate identification is crucial.
Step 1: Examine Historical Price Action
Look for areas where prices repeatedly reversed direction.
Step 2: Identify Multiple Touch Points
The more times a level has been tested, the more significant it becomes.
Step 3: Use Higher Time Frames
Weekly and monthly support and resistance levels generally carry more importance than intraday levels.
Step 4: Confirm with Volume
Significant volume often strengthens support and resistance zones.
Support Becoming Resistance
One of the most important concepts in technical analysis is role reversal.
When support breaks:
- Former buyers may become sellers.
- The broken support often becomes new resistance.
This phenomenon occurs because market participants adjust expectations based on changing price behavior.
Resistance Becoming Support
Similarly, when prices break above resistance:
- Former resistance frequently becomes support.
- Breakout traders often enter positions.
- Institutional buying may increase.
This principle forms the basis of many breakout trading strategies.
Breakout Trading Strategies
Breakouts occur when prices move decisively beyond support or resistance levels.
Bullish Breakout
A bullish breakout occurs when prices move above resistance.
Potential implications:
- New buyers enter the market.
- Short sellers may cover positions.
- Momentum often accelerates.
Bearish Breakdown
A bearish breakdown occurs when support fails.
This often signals:
- Increasing selling pressure
- Changing market sentiment
- Potential trend continuation
| Breakout Type | Potential Signal |
|---|---|
| Bullish Breakout | Uptrend Continuation |
| Bearish Breakdown | Downtrend Continuation |
False Breakouts
Not all breakouts succeed.
False breakouts occur when prices briefly move beyond a level before reversing.
Common causes include:
- Low trading volume
- Market manipulation
- Institutional liquidity hunts
- Weak momentum
Confirmation techniques help reduce false breakout risk.
Volume Analysis and Support Resistance
Volume provides valuable confirmation.
Strong volume often indicates:
- Institutional participation
- Greater conviction
- More reliable breakouts
| Volume Condition | Interpretation |
|---|---|
| High Volume Breakout | Strong Confirmation |
| Low Volume Breakout | Potential Failure Risk |
| High Volume Support Bounce | Strong Buyer Interest |
| High Volume Rejection | Strong Seller Activity |
Combining Support and Resistance with Candlestick Patterns
Candlestick patterns become more powerful when they form near key levels.
Examples include:
- Hammer at support
- Bullish engulfing near support
- Shooting star at resistance
- Bearish engulfing near resistance
These combinations often provide higher-probability trading opportunities.
Using Moving Averages as Dynamic Support and Resistance
Moving averages frequently influence price behavior.
Common moving averages include:
- 20-Day EMA
- 50-Day SMA
- 100-Day SMA
- 200-Day SMA
Many institutional investors monitor these indicators, making them important market reference points.
Support and Resistance Across Different Markets
Stock Markets
Support and resistance help identify accumulation and distribution zones.
Forex Markets
Currency traders heavily rely on support and resistance due to the technical nature of forex markets.
Cryptocurrency Markets
Crypto traders frequently use support and resistance because digital assets often experience strong momentum-driven moves.
Options Trading
Support and resistance assist options traders with timing entries and selecting strike prices.
Risk Management Using Support and Resistance
Support and resistance provide logical locations for risk management.
- Stop losses below support
- Stop losses above resistance
- Profit targets near opposing levels
- Position sizing based on risk distance
| Trade Type | Common Stop Placement |
|---|---|
| Long Position | Below Support |
| Short Position | Above Resistance |
Common Mistakes Traders Make
- Treating levels as exact prices instead of zones
- Ignoring volume confirmation
- Trading every breakout
- Ignoring broader market trends
- Using levels without risk management
- Overcomplicating chart analysis
Successful traders recognize that support and resistance are areas of probability, not guarantees.
How Institutional Traders Use Support and Resistance
Large institutions often monitor:
- Weekly support levels
- Monthly resistance zones
- Volume profile areas
- Liquidity pools
- Market structure levels
Institutional participation frequently strengthens major support and resistance areas.
Support and Resistance in Modern Algorithmic Markets
Today's markets are increasingly influenced by:
- Algorithmic trading
- Artificial intelligence
- Machine learning models
- Quantitative trading systems
Despite technological evolution, support and resistance remain relevant because many algorithms are programmed to react to these key market levels.
Building a Complete Trading Strategy
Support and resistance work best when integrated with:
- Trend analysis
- Volume analysis
- Candlestick patterns
- Moving averages
- Risk management principles
- Trading psychology discipline
No single tool guarantees success, but support and resistance provide a valuable framework for decision-making.
Final Thoughts
Support and resistance levels remain among the most important concepts in technical analysis because they reflect the ongoing interaction between buyers and sellers. These price zones help traders understand market structure, identify trading opportunities, manage risk, and improve overall decision-making.
Whether trading stocks, forex, options, futures, commodities, ETFs, or cryptocurrencies, support and resistance provide a practical framework for analyzing price action and market behavior. By combining these levels with volume analysis, candlestick patterns, trend analysis, and disciplined risk management, traders can significantly enhance their ability to navigate modern financial markets.
Ultimately, successful trading is not about predicting every market move. It is about identifying high-probability opportunities, managing risk effectively, and consistently applying proven principles such as support and resistance analysis over the long term.