Stock Market Indicators Explained in Simple Terms
The stock market generates enormous amounts of data every second. Prices rise and fall, trading volume fluctuates, trends emerge, and investor sentiment changes continuously. For beginners, understanding all of this information can feel overwhelming. This is where stock market indicators become valuable.
Stock market indicators are tools used by traders and investors to analyze market behavior, identify trends, measure momentum, evaluate risk, and improve decision-making. Whether you are investing in stocks, ETFs, options, forex, commodities, or cryptocurrencies, indicators can provide useful insights into market conditions.
Professional traders, hedge funds, investment firms, and even artificial intelligence trading systems rely on indicators to help interpret market data. However, many beginners mistakenly believe indicators predict the future. In reality, indicators help investors understand probabilities, trends, and market conditions rather than guarantee specific outcomes.
This comprehensive guide explains the most important stock market indicators in simple language, helping beginners build a solid foundation for technical analysis and smarter investing.
What Are Stock Market Indicators?
Stock market indicators are mathematical calculations based on price, volume, or market activity. They help traders understand trends, momentum, volatility, and potential trading opportunities.
Indicators transform raw market data into visual signals that can be easier to interpret.
| Indicator Type | Main Purpose |
|---|---|
| Trend Indicators | Identify Market Direction |
| Momentum Indicators | Measure Speed of Price Movement |
| Volume Indicators | Analyze Trading Activity |
| Volatility Indicators | Measure Market Risk |
| Breadth Indicators | Evaluate Overall Market Strength |
Why Investors Use Indicators
Indicators help investors:
- Identify market trends
- Find potential entry points
- Locate exit opportunities
- Manage investment risk
- Confirm trading decisions
- Measure market strength
- Improve consistency
Many successful investors use indicators as part of a broader investment strategy rather than relying on a single signal.
Understanding Trend Indicators
Trend indicators help determine the overall direction of a market.
The famous saying 'the trend is your friend' reflects the importance of identifying market direction before making investment decisions.
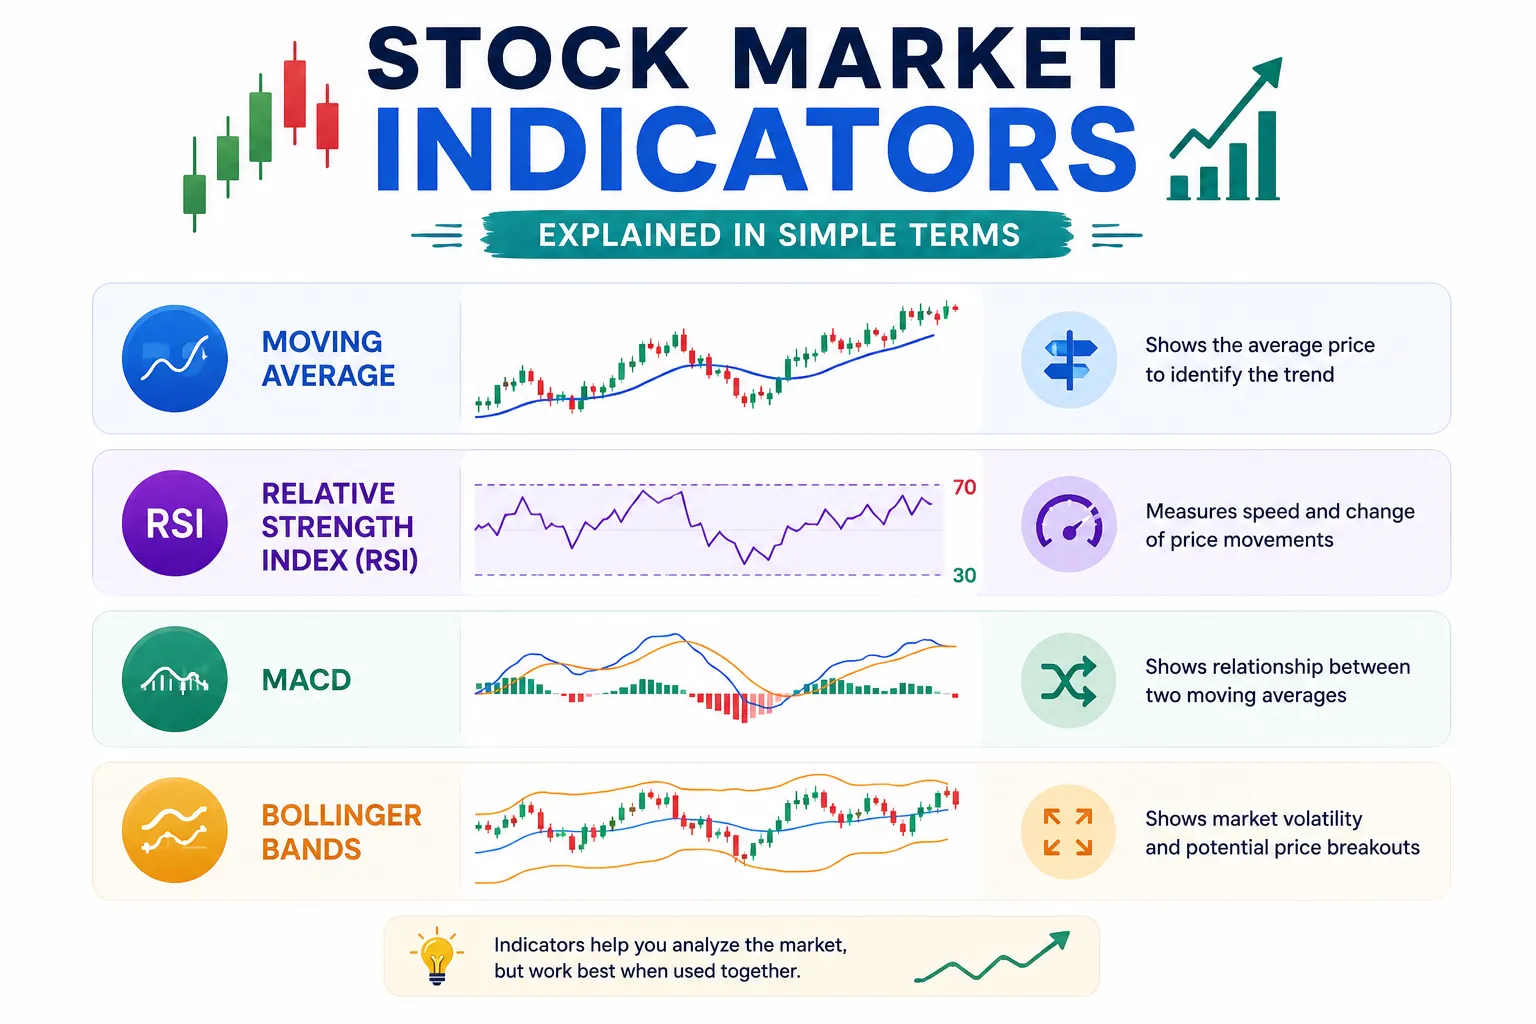
Moving Averages
Moving averages are among the most widely used indicators in financial markets.
They smooth price data and help investors identify trends.
Popular moving averages include:
- 20-Day Moving Average
- 50-Day Moving Average
- 100-Day Moving Average
- 200-Day Moving Average
| Moving Average | Common Use |
|---|---|
| 20-Day | Short-Term Trend |
| 50-Day | Intermediate Trend |
| 100-Day | Medium-Term Trend |
| 200-Day | Long-Term Trend |
When prices remain above a moving average, it often suggests bullish conditions. When prices fall below a moving average, bearish conditions may exist.
Simple Moving Average (SMA) vs Exponential Moving Average (EMA)
Simple Moving Average (SMA)
The SMA calculates the average closing price over a specific period.
It reacts more slowly to recent price changes.
Exponential Moving Average (EMA)
The EMA gives greater weight to recent prices.
Because it reacts faster, many swing traders prefer EMAs.
| Feature | SMA | EMA |
|---|---|---|
| Reaction Speed | Slower | Faster |
| Weighting | Equal | Recent Prices Weighted More |
| Best Use | Long-Term Analysis | Short-Term Trading |
Relative Strength Index (RSI)
The Relative Strength Index (RSI) is one of the most popular momentum indicators.
RSI measures how quickly prices have moved over a specific period.
RSI values range between 0 and 100.
- Above 70 = Potentially Overbought
- Below 30 = Potentially Oversold
Many traders use RSI to identify possible reversal opportunities.
However, strong trends can keep RSI elevated or depressed for extended periods.
MACD (Moving Average Convergence Divergence)
The MACD helps traders analyze trend strength and momentum.
It consists of:
- MACD Line
- Signal Line
- Histogram
When the MACD line crosses above the signal line, traders often interpret it as bullish.
When it crosses below, bearish momentum may be increasing.
| Signal | Interpretation |
|---|---|
| MACD Above Signal | Bullish Momentum |
| MACD Below Signal | Bearish Momentum |
| Histogram Expanding | Trend Strengthening |
| Histogram Shrinking | Momentum Weakening |
Bollinger Bands Explained Simply
Bollinger Bands help investors understand volatility.
The indicator consists of:
- Middle Moving Average
- Upper Band
- Lower Band
When volatility increases, the bands widen.
When volatility decreases, the bands contract.
Many traders monitor Bollinger Bands for breakout opportunities and volatility shifts.
Volume Indicators
Volume measures the number of shares or contracts traded during a period.
Volume often confirms the strength of price movements.
Why Volume Matters
- Strong volume confirms trends.
- Low volume may signal weak conviction.
- High volume often accompanies breakouts.
- Institutional participation frequently increases volume.
| Volume Behavior | Potential Meaning |
|---|---|
| High Volume Rally | Strong Buying Interest |
| High Volume Selloff | Strong Selling Pressure |
| Low Volume Breakout | Possible False Signal |
| Rising Volume | Growing Market Participation |
On-Balance Volume (OBV)
OBV combines price and volume to identify buying and selling pressure.
If OBV rises alongside prices, it often confirms trend strength.
If OBV diverges from price movement, caution may be warranted.
Average True Range (ATR)
ATR measures market volatility.
Unlike some indicators, ATR does not indicate direction.
Instead, it shows how much prices typically move.
Higher ATR values suggest increased volatility, while lower values indicate calmer market conditions.
Stochastic Oscillator
The Stochastic Oscillator compares a security's closing price to its recent price range.
Like RSI, it helps identify overbought and oversold conditions.
- Above 80 = Potentially Overbought
- Below 20 = Potentially Oversold
Many traders use Stochastic indicators to find short-term reversal opportunities.
Support and Resistance Indicators
Support and resistance are not always traditional indicators, but they are among the most important analytical tools.
Support
A price level where buying interest tends to emerge.
Resistance
A price level where selling pressure tends to increase.
Support and resistance levels help traders:
- Find entry points
- Set stop-loss orders
- Determine profit targets
- Manage risk
Trend Strength Indicators
Average Directional Index (ADX)
ADX measures trend strength regardless of direction.
| ADX Value | Trend Strength |
|---|---|
| Below 20 | Weak Trend |
| 20-40 | Moderate Trend |
| Above 40 | Strong Trend |
Many traders use ADX to determine whether trend-following strategies are appropriate.
Market Breadth Indicators
Market breadth indicators measure participation across the broader market.
Examples include:
- Advance-Decline Line
- New Highs vs New Lows
- Market Participation Ratios
These indicators help investors determine whether market strength is widespread or concentrated in a few stocks.
Combining Indicators Effectively
Professional traders rarely rely on a single indicator.
A common approach may include:
- Moving Average for trend direction
- RSI for momentum
- Volume for confirmation
- Support and Resistance for trade planning
Combining indicators can improve analysis quality while reducing false signals.
Common Indicator Mistakes
| Mistake | Potential Problem |
|---|---|
| Using Too Many Indicators | Analysis Paralysis |
| Ignoring Market Context | Poor Decisions |
| Relying on One Signal | False Confidence |
| Over-Optimizing Strategies | Unrealistic Expectations |
| Ignoring Risk Management | Large Losses |
Indicators in Modern Markets
Today's markets are influenced by:
- Artificial Intelligence
- Algorithmic Trading
- High-Frequency Trading
- Institutional Quantitative Models
- Machine Learning Systems
Despite technological advances, traditional indicators remain widely used because they reflect fundamental market behavior and investor psychology.
Indicators for Different Investment Styles
| Investment Style | Popular Indicators |
|---|---|
| Day Trading | VWAP, RSI, MACD |
| Swing Trading | Moving Averages, RSI, Volume |
| Position Trading | 200-Day MA, ADX, Volume |
| Long-Term Investing | Moving Averages, Market Breadth |
Risk Management and Indicators
Indicators should support risk management rather than replace it.
Successful investors still use:
- Position sizing
- Diversification
- Stop-loss orders
- Portfolio allocation rules
- Long-term planning
Indicators help identify opportunities, but risk management protects capital.
Final Thoughts
Stock market indicators are valuable tools that help investors and traders interpret market data more effectively. While no indicator can predict future price movements with certainty, they can provide insights into trends, momentum, volatility, volume, and market strength.
For beginners, understanding moving averages, RSI, MACD, Bollinger Bands, volume analysis, ATR, and support and resistance provides a strong foundation for technical analysis. As experience grows, investors can combine multiple indicators to create structured strategies tailored to their goals and risk tolerance.
The most successful investors recognize that indicators are tools—not guarantees. When combined with disciplined risk management, sound financial planning, and a long-term perspective, stock market indicators can become powerful components of an effective investing and trading framework.