How Technical Analysis Works in Modern Markets
Financial markets have evolved dramatically over the past few decades. High-frequency trading, artificial intelligence, machine learning, institutional algorithms, global market connectivity, and real-time data have transformed the way investors and traders analyze price movements. Despite these technological advancements, one analytical framework remains widely used across global markets: technical analysis.
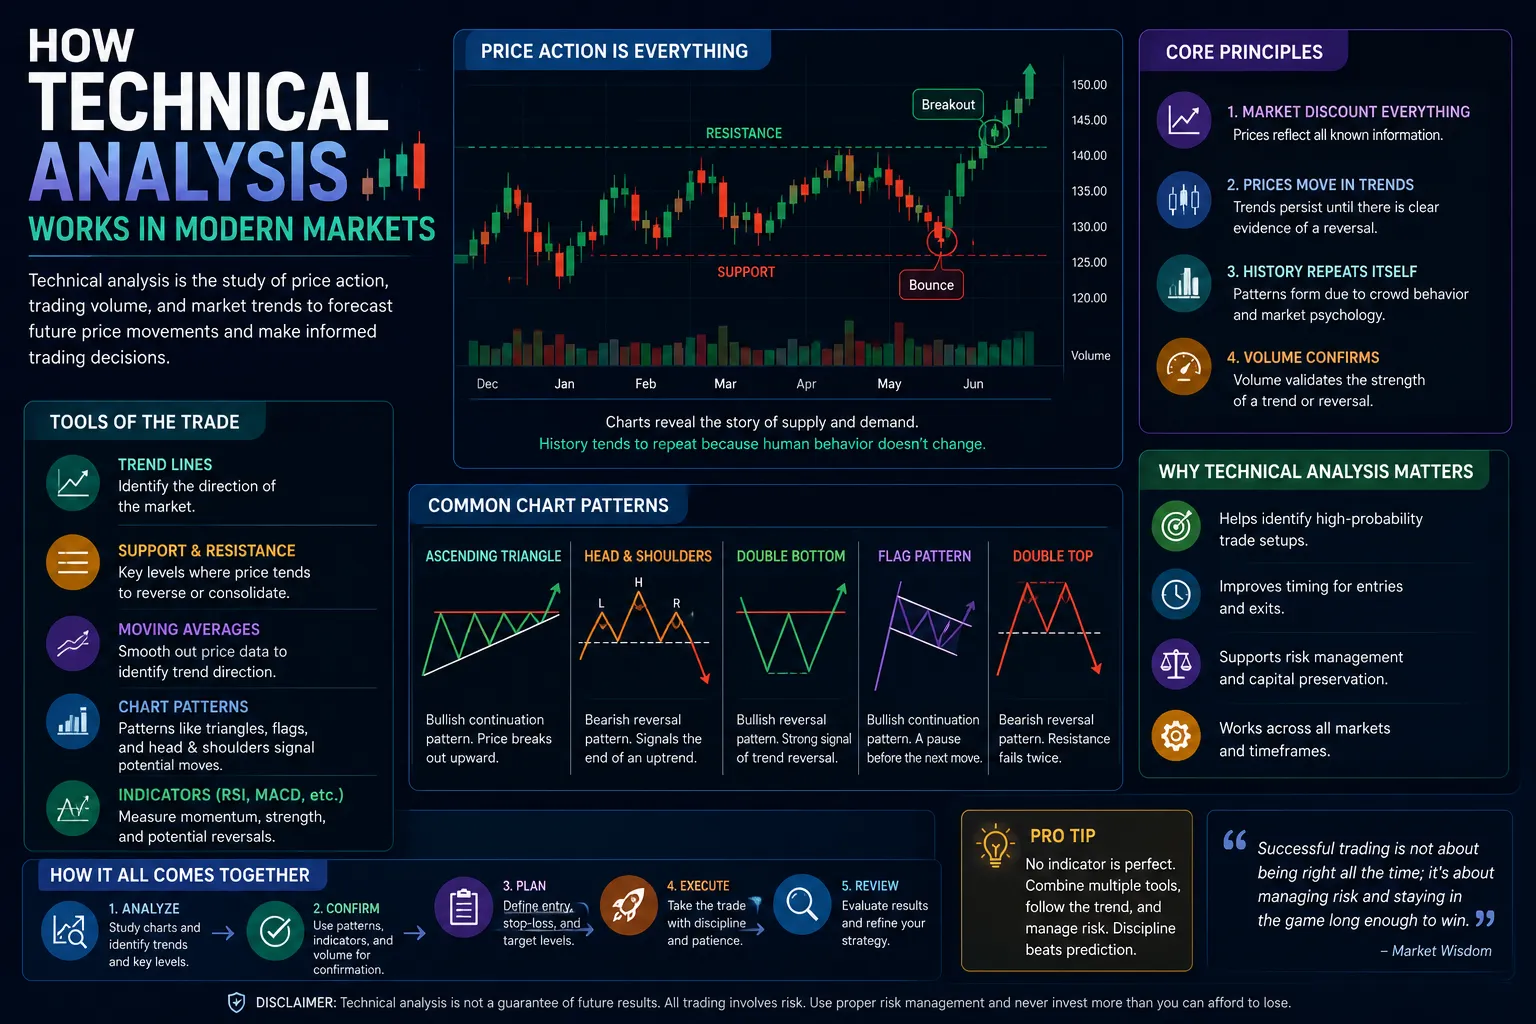
Technical analysis helps traders and investors evaluate financial instruments by studying historical price action, volume data, chart patterns, market trends, and trading indicators. Unlike fundamental analysis, which focuses on company financials, economic conditions, and intrinsic value, technical analysis primarily examines market behavior.
Today, technical analysis is used across stocks, ETFs, forex markets, commodities, cryptocurrencies, futures contracts, options trading, and even alternative investment products. Professional traders, hedge funds, quantitative analysts, portfolio managers, and retail investors all utilize various forms of technical analysis to make investment decisions.
This comprehensive guide explains how technical analysis works in modern markets, explores the most widely used indicators, examines chart patterns, discusses algorithmic trading influences, and highlights best practices for risk management.
What Is Technical Analysis?
Technical analysis is the study of historical market data, primarily price and trading volume, to forecast future market movements.
The core principle is simple:
- Market prices reflect available information.
- Price movements often follow identifiable trends.
- Historical patterns tend to repeat due to investor psychology.
Technical analysts believe that analyzing price behavior can provide valuable insights into future market direction.
The Three Core Assumptions of Technical Analysis
1. The Market Discounts Everything
Technical analysts assume that all publicly available information is already reflected in asset prices, including:
- Corporate earnings
- Economic data
- Interest rates
- Political developments
- Investor sentiment
2. Prices Move in Trends
Markets often exhibit directional movement rather than random behavior.
Trends can be:
- Uptrends
- Downtrends
- Sideways consolidations
3. History Repeats Itself
Human emotions such as fear, greed, optimism, and panic influence market behavior. Because these emotions remain relatively constant, certain chart patterns often reappear across different market cycles.
Why Technical Analysis Remains Relevant in Modern Markets
Despite advances in artificial intelligence and quantitative finance, technical analysis remains important because market participants continue reacting to price movements and investor sentiment.
Modern traders use technical analysis to:
- Identify trends
- Determine entry points
- Manage risk
- Set profit targets
- Improve timing decisions
- Monitor market momentum
- Analyze volatility
Many institutional trading systems also incorporate technical indicators into their quantitative models.
Types of Financial Markets Using Technical Analysis
| Market | Technical Analysis Usage | Popularity |
|---|---|---|
| Stocks | Very High | Extensive |
| Forex | Extremely High | Global |
| Cryptocurrency | Extremely High | Growing |
| Commodities | High | Institutional |
| Futures | Very High | Professional |
| Options | High | Advanced |
| ETFs | High | Retail & Institutional |
Understanding Price Charts
Price charts are the foundation of technical analysis.
The most common chart types include:
- Line Charts
- Bar Charts
- Candlestick Charts
- Heikin Ashi Charts
- Renko Charts
- Point and Figure Charts
Candlestick charts are particularly popular because they provide detailed information regarding opening prices, closing prices, highs, and lows.
Candlestick Analysis
Candlesticks visually represent market sentiment during specific periods.
Common candlestick patterns include:
- Doji
- Hammer
- Shooting Star
- Engulfing Pattern
- Morning Star
- Evening Star
- Harami Pattern
These patterns can provide clues regarding potential trend reversals or continuations.
Support and Resistance Levels
Support and resistance are among the most important concepts in technical analysis.
Support
Support represents a price level where buying interest tends to emerge.
Resistance
Resistance represents a price level where selling pressure often increases.
Professional traders frequently monitor these levels because they influence market psychology and trading decisions.
Trend Analysis
Identifying trends remains a primary objective of technical analysis.
| Trend Type | Characteristics |
|---|---|
| Uptrend | Higher Highs and Higher Lows |
| Downtrend | Lower Highs and Lower Lows |
| Sideways Trend | Range-Bound Movement |
Trend-following strategies often seek to align trades with prevailing market direction.
Moving Averages
Moving averages help smooth price fluctuations and identify underlying trends.
Popular moving averages include:
- 20-Day Moving Average
- 50-Day Moving Average
- 100-Day Moving Average
- 200-Day Moving Average
Traders frequently monitor moving average crossovers as potential trading signals.
Relative Strength Index (RSI)
RSI is a momentum oscillator used to evaluate whether a market may be overbought or oversold.
| RSI Reading | Interpretation |
|---|---|
| Above 70 | Potentially Overbought |
| 50-70 | Bullish Momentum |
| 30-50 | Bearish Momentum |
| Below 30 | Potentially Oversold |
RSI is widely used across stock, forex, and cryptocurrency markets.
MACD Indicator
The Moving Average Convergence Divergence (MACD) indicator measures trend strength and momentum.
MACD helps traders identify:
- Trend reversals
- Momentum shifts
- Bullish crossovers
- Bearish crossovers
Many professional traders combine MACD with moving averages and support/resistance analysis.
Volume Analysis
Volume measures the number of shares, contracts, or units traded during a specific period.
Volume often confirms price action.
Examples:
- Rising prices with increasing volume may indicate strong demand.
- Falling prices with heavy volume may indicate aggressive selling pressure.
- Breakouts supported by strong volume tend to be more reliable.
Chart Patterns Used by Traders
Chart patterns help traders identify potential continuation or reversal opportunities.
Reversal Patterns
- Head and Shoulders
- Inverse Head and Shoulders
- Double Top
- Double Bottom
- Triple Top
- Triple Bottom
Continuation Patterns
- Flags
- Pennants
- Triangles
- Rectangles
- Channels
These patterns remain popular because they reflect recurring behavioral tendencies among market participants.
Technical Analysis in Algorithmic Trading
Modern financial markets are heavily influenced by algorithmic trading systems.
Many algorithms incorporate technical factors such as:
- Price momentum
- Moving averages
- Volatility measures
- Trend strength indicators
- Volume analysis
- Breakout signals
Large hedge funds and quantitative trading firms often combine technical indicators with machine learning models to improve decision-making.
Artificial Intelligence and Technical Analysis
Artificial intelligence is transforming technical analysis.
AI-powered trading systems can:
- Analyze massive datasets
- Identify hidden correlations
- Detect emerging patterns
- Evaluate sentiment data
- Optimize trade execution
However, human judgment remains valuable because markets frequently experience unexpected events that algorithms may struggle to interpret.
Risk Management: The Most Important Trading Skill
Technical analysis can improve decision-making, but no indicator predicts markets with complete accuracy.
Successful traders prioritize risk management through:
- Position sizing
- Stop-loss orders
- Diversification
- Risk-reward analysis
- Portfolio allocation controls
| Risk Management Tool | Purpose |
|---|---|
| Stop Loss | Limit Losses |
| Take Profit | Secure Gains |
| Position Sizing | Control Exposure |
| Diversification | Reduce Concentration Risk |
| Risk-Reward Ratio | Improve Trade Efficiency |
Common Mistakes Traders Make
- Overtrading
- Ignoring risk management
- Using too many indicators
- Chasing market momentum
- Emotional decision-making
- Failing to follow trading plans
- Ignoring broader market conditions
Many losses occur because traders abandon discipline rather than because technical analysis fails.
Technical Analysis vs Fundamental Analysis
| Factor | Technical Analysis | Fundamental Analysis |
|---|---|---|
| Primary Focus | Price & Volume | Financial Data |
| Time Horizon | Short to Medium Term | Long Term |
| Key Tools | Charts & Indicators | Financial Statements |
| Market Timing | Strong | Limited |
| Valuation Analysis | Minimal | Extensive |
Many successful investors combine both approaches to improve investment decisions.
The Future of Technical Analysis
As financial markets continue evolving, technical analysis is becoming increasingly integrated with advanced technologies.
Emerging developments include:
- AI-driven chart recognition
- Machine learning models
- Alternative data analytics
- Real-time sentiment analysis
- Quantitative trading systems
- Predictive market modeling
Rather than replacing traditional technical analysis, these technologies are enhancing its effectiveness.
Final Thoughts
Technical analysis remains one of the most widely used methods for evaluating financial markets. By studying price action, volume, chart patterns, momentum indicators, and market trends, traders gain valuable insights into potential market behavior.
Modern markets are increasingly influenced by algorithmic trading, artificial intelligence, and quantitative strategies, yet technical analysis continues to play a central role in investment decision-making. Its flexibility allows application across stocks, forex, cryptocurrencies, commodities, ETFs, and futures markets.
While no trading method guarantees success, combining technical analysis with sound risk management, disciplined execution, and ongoing education can significantly improve a trader's ability to navigate today's complex financial markets and pursue long-term profitability.